This strategy got them to 450K monthly visits
How Coda drives 99.7% of its organic traffic through one subfolder
👋 Hey, I’m George Chasiotis. Welcome to GrowthWaves, your weekly dose of B2B growth insights—featuring powerful case studies, emerging trends, and unconventional strategies you won’t find anywhere else.
A few days ago, I remembered one of the best headlines I ever saw on a SaaS website.
It’s this one:
The company behind this great copy is Coda.
“I haven’t visited their website for a while,” I thought.
While on the website, I murmured something along the lines of:
“That’s quite an improvement; well done, Coda team.”
Then, I decided to check their organic search performance.
And suddenly things got very interesting.
Here’s why.
Key findings
Before reviewing Coda’s case in more detail, let’s quickly discuss the most noteworthy key findings.
Organic traffic growth doesn’t have to be a smooth process. Coda’s traffic went from growing by 57% in the first quarter of 2022 to dropping by 33% in the next quarter of the same year. Nevertheless, it stabilized eventually, and Coda’s website reached 501,191 clicks by the end of Q4 of 2023.
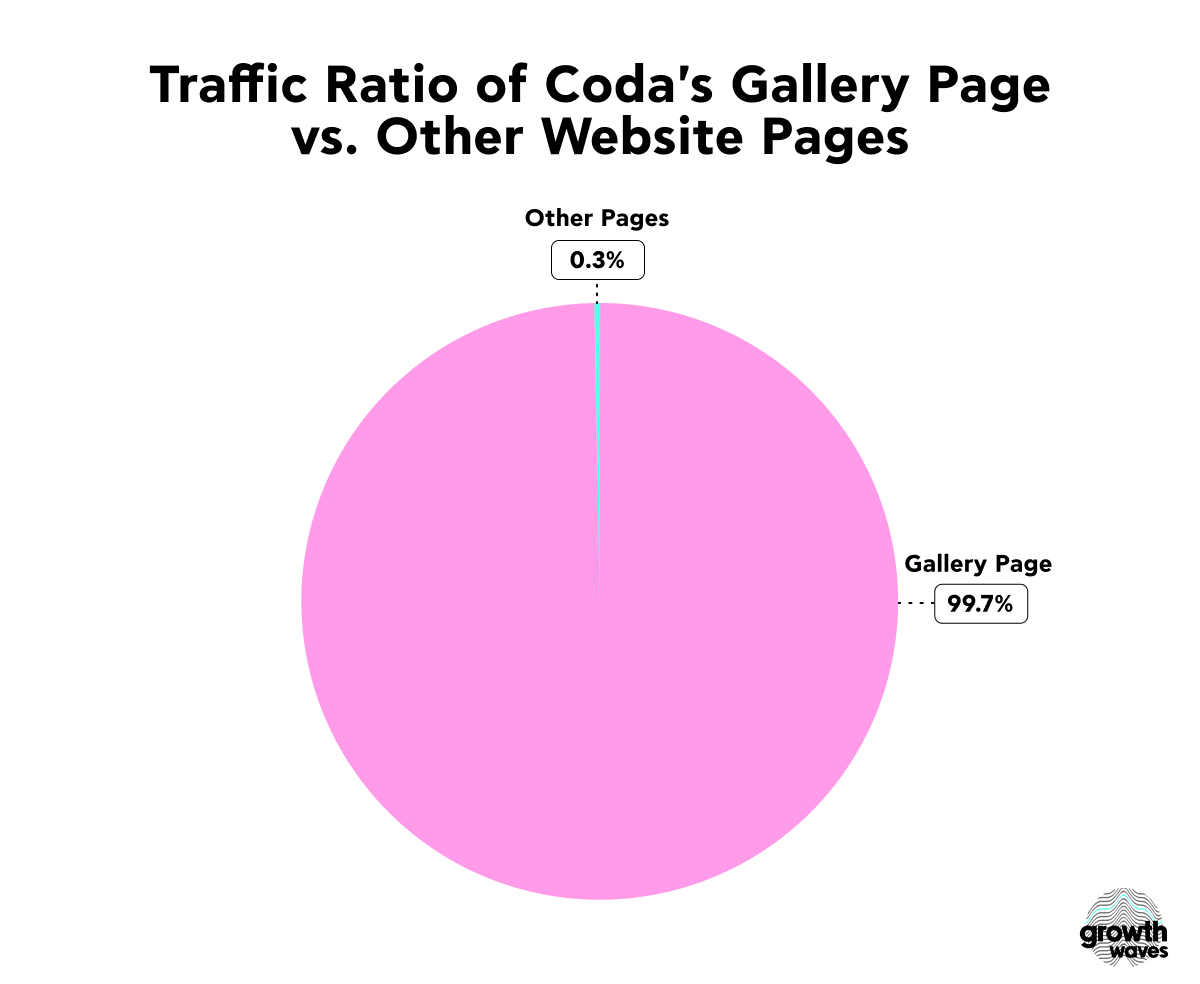
Only one subfolder on your website can already deliver 99.7% of its traffic. Items (docs and packs) in Coda’s Gallery drive 465,932 out of its entire traffic (463,841 as of February 6, 2024), which means other pages bring in only 0.3% of clicks.
Coda’s Gallery hosts 22,357 pages (both docs and packs), but only 73 deliver over 1K monthly visits.
These 73 pages bring in 383,057 clicks—82.2% of Coda’s website traffic.
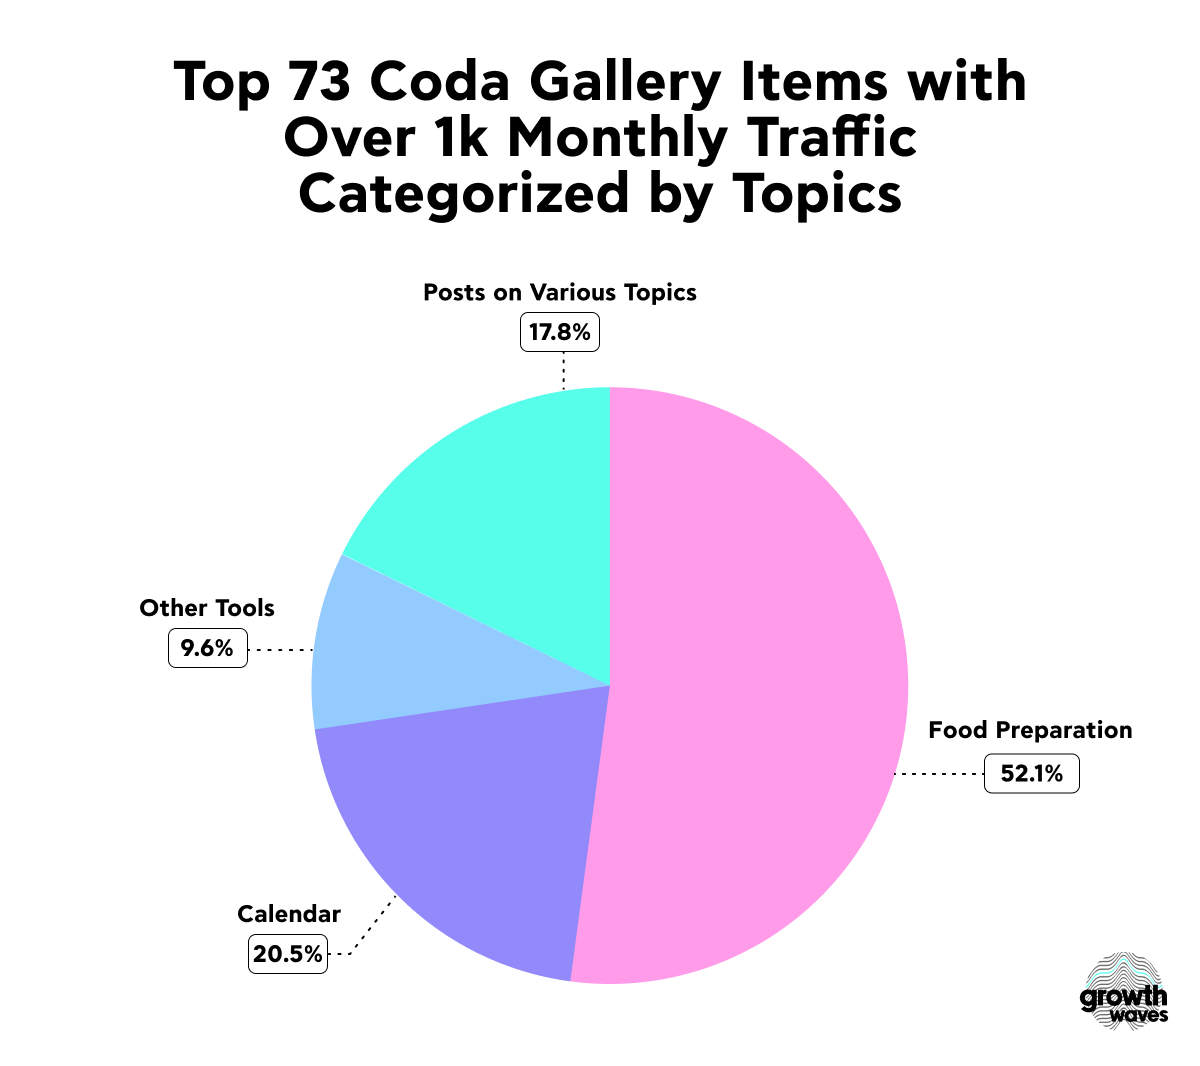
The top-performing items in the Gallery are not related to project management or workflow automation. 52% of top-ranking pages offer tools useful during food preparation, 20.5% are related to calendar management, 17.8% include posts on different topics, and 9.6% consist of other tools.
Fascinating, right?
Let’s look more into this case.
Organic growth breakdown
Right away, I wouldn’t call Coda’s organic traffic growth consistent.
Let me explain.
The first organic visits started coming in on October 31, 2017.
However, their number would fluctuate considerably (e.g., from 42,218 visits on November 28, 2020, to 33,753 visits on December 1, 2020) until finally becoming more or less consistent in the third quarter of 2021.
That’s when the first traffic surge happened (from 74,551 visits on July 30, 2021, to 125,733 visits on August 3, 2021).
Here’s the total quarterly organic traffic breakdown to show you the full picture.
From these numbers, you can already spot some inconsistencies in organic traffic growth. In percentages, they appear like this:
Currently (as of February 6, 2024), Coda’s organic traffic is at 467,031 monthly visits—a 6% increase from December 2023.
So, which of Coda’s website pages delivers most of this traffic?
First, let’s quickly review Coda’s website architecture to see which pages are present there in general.
So, we see several subfolders here, plus some essential pages in Coda’s website architecture.
But you’ll be surprised to learn that only one subfolder delivers 99.7% of Coda’s organic traffic.
I’m talking about the Gallery subfolder.
Although the Gallery itself only delivers 340 organic clicks a month, the items under its umbrella (top-ranking pages) bring 465,932 monthly visits (as of February 6, 2024), which is 99.7% of Coda’s organic traffic.
The remaining 0.3% of traffic comes from Coda’s homepage, Sign In, Pricing, and other pages.
Sounds fascinating, right?
Let’s break down the case of Coda’s Gallery and items found through it to understand why they drive so much traffic.
How Coda drives 99.7% of its website traffic through items in Gallery
Do you remember the GrowthWaves Note #10, where we discussed content distribution through Template pages and discussed examples from Notion, Miroverse, and Trello?
Coda is another example of that, but I’d say it’s a more successful one in terms of organic performance.
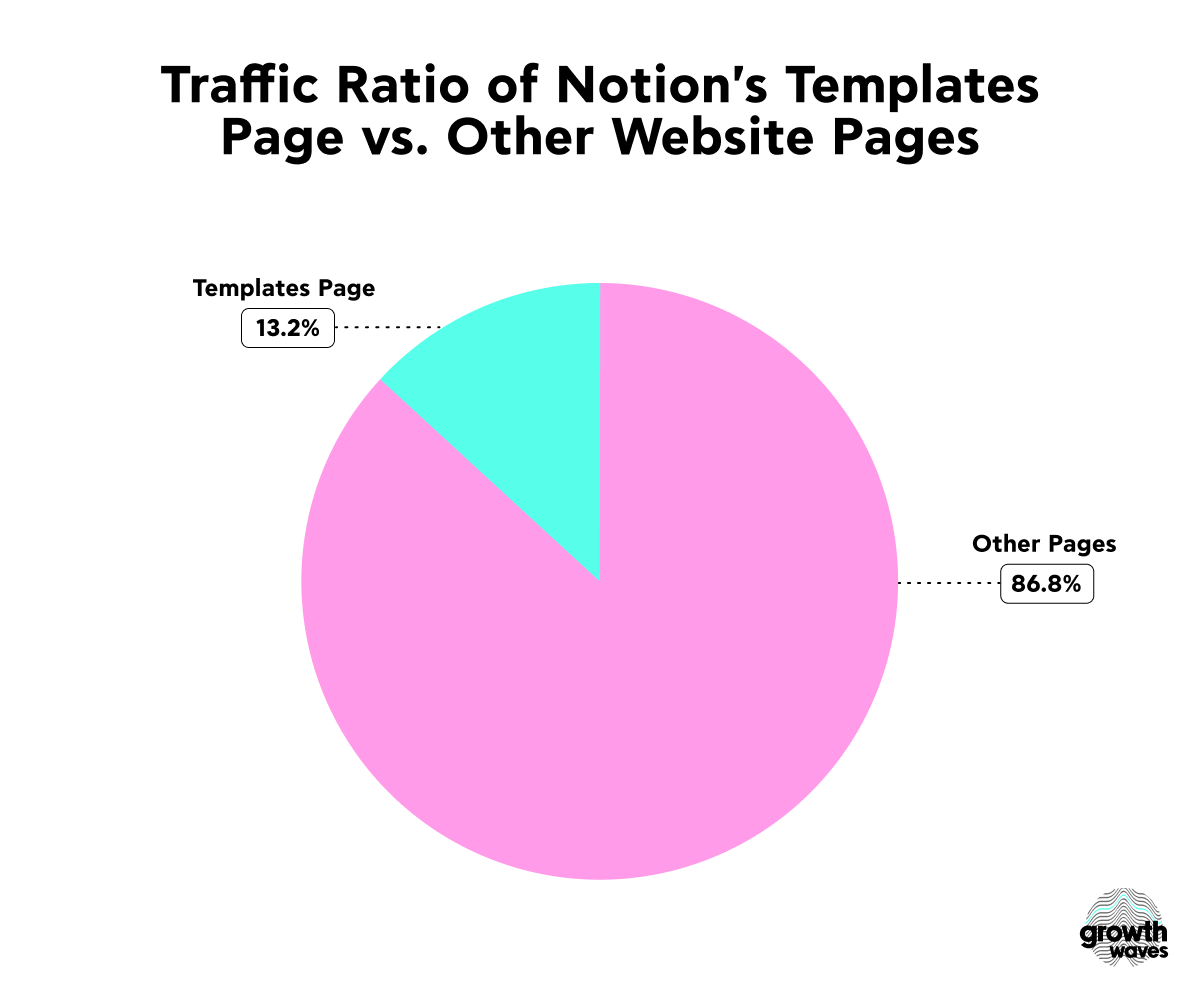
Just take a look at the traffic distribution between Notion’s, Miro’s, and Trello’s Template pages.
Here are the results for Notion.
Below we have the case of Miro Miroverse.
And, finally, the organic performance of Trello’s Templates page.
In Coda’s case, it’s an entirely different picture.
So, what’s so special about Coda’s Gallery subfolder?
Let’s break down its architecture to understand its structure.
According to Ahrefs, the overall number of pages inside the Gallery is 22,357 (as of February 6, 2024), which is more than Notion has (21,705).
The Gallery includes docs and packs.
Docs are free to use, but packs are both free and paid.
Overall, there are 414 pages under the Packs subfolder (according to Ahrefs as of February 6, 2024).
A pack itself offers a set of tools to integrate Coda with other tools. Most of these toolkits were created by the team at Coda, offering integrations with other workflow automation tools like Jira or Asana, as well as other popular SaaS solutions.

As I mentioned, some packs, both by Coda and other creators, are paid. So, it’s an excellent opportunity for the company and its users to monetize their creations.
Altogether, packs bring Coda 733 monthly organic visits, which is only 0.1% of the Gallery’s entire traffic—just a sliver in the chart below.
All templates (docs and packs) are divided into three categories for convenient browsing: by Team, by Scenario, and by Theme.
In turn, these categories include several subcategories.
By Team: Product, Marketing, Sales & success, Engineering, Finance, Education, and HR & recruiting.
By Scenario: Planning & OKRs, AI work assistant, Project management, Meetings, and Knowledge management.
By Theme: Personal productivity, Travel, Health & wellness, and Entertainment.
So, docs, including templates, trackers, kits, etc., cover various topics.
In fact, you’ll be surprised to learn that the highest-ranking template is not even related to the topics of project management relevant to Coda’s product.
It is an interactive calculator by Leila Robinson that helps you estimate how many cups equal one ounce.

This got me thinking: how many of Coda’s Gallery items, both docs and packs, bringing at least 1K monthly traffic, are related to project management and workflow automation?
Here’s what I have found.
Altogether, 73 Gallery items deliver 1K monthly visits. Their overall traffic is 383,057—82.2% out of Coda’s entire traffic.
Below, you can see all of them listed according to their organic performance.
The list doesn’t include packs since none of them have traffic over 1k monthly visits.
To summarize this long table for you, none of these docs touch upon project management or automation workflow, though one can argue that certain calculators (e.g., how many weekends in one year) can be used in some workflow processes.
Here’s the total breakdown of the items in the table by topic and percentages.
Immediately, you might think, what’s the deal with all this?
Why does the most traffic come from pages targeting search terms completely unrelated to Coda?
And why has Coda chosen to drive traffic through this channel in particular?
Here’s how I see this.
First and foremost, keywords related to project management and automation workflow do not always have as high of a search volume as keywords on more general topics.
Let’s consider a couple of examples.
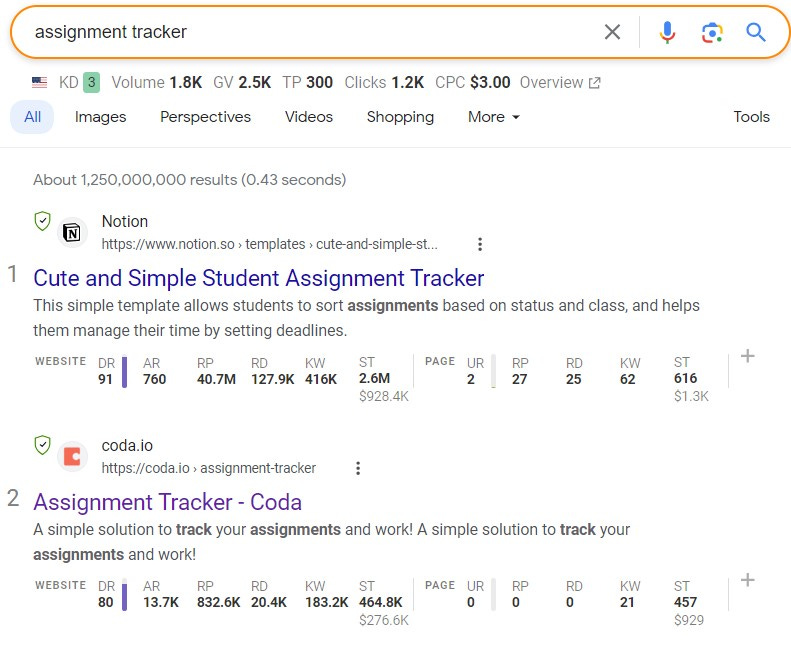
One of the top-ranking items on workflow automation in Coda’s Gallery is this assignment tracker.
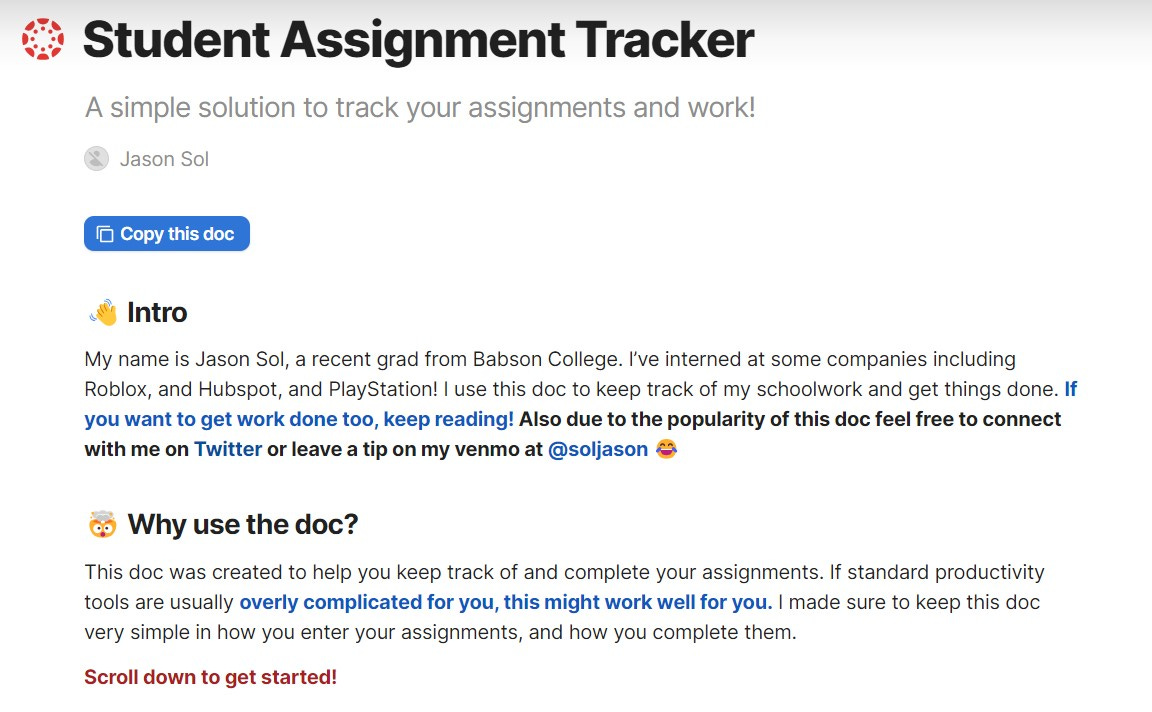
The main keyword here is “assignment tracker”, which has a good search volume and traffic potential.
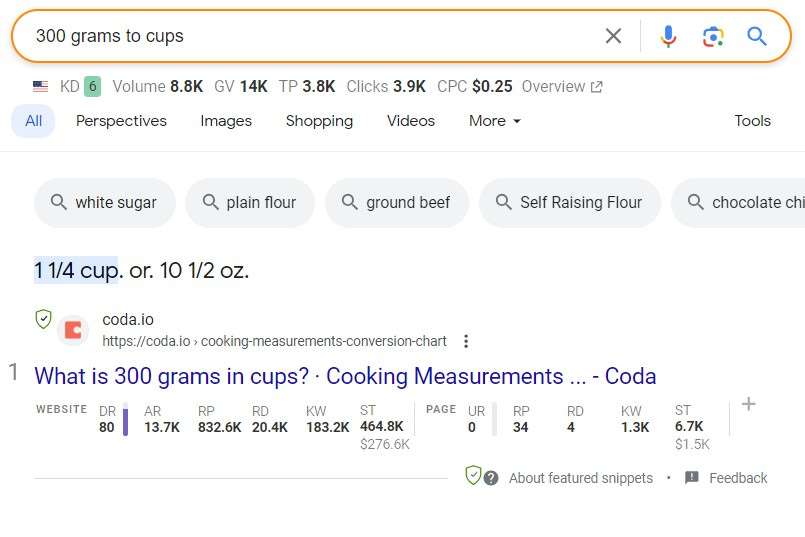
Yet, it doesn’t drive as much traffic as, say, one of the Gallery’s top performers in this regard—300 grams to cups converter, although both rank high in their respective Google results (in the U.S. search since I tracked numbers from that location).
The assignment tracker ranks at position #2 after a similar tool on Notion.
In its turn, the 300 grams to cups converter occupied position #1 in SERPs, also claiming the featured snippet.
And, as I mentioned, the search term this converter is targeting has more search volume. In fact, 79.5% more than the assignment tracker.
Alright, you might say, but search volume is not the only factor impacting ranking.
You are totally correct.
I’d say search intent plays a far more important role here.
Think about it.
When people enter 300 grams to cups in the search bar, what do they expect?
Most likely, either a direct answer or a tool helping them convert one unit of weight into another.
The same goes for the assignment tracker and other similar tools in Coda’s Gallery—people click on them because they answer a particular search intent, which consequently impacts Coda’s trustworthiness.
It also helps that most of this content is user-generated.
Although it was repeated many times that UGC content is not a ranking factor and, when used excessively (as spam), can lead to manual action against a website, it is considered valuable by Google as long as it follows one simple rule.
While content, no matter if created by your company or outside users, is relevant and of high value (meets the standards of content published on your website), Google recognizes it as useful.
UGC content in Coda’s Gallery matches these criteria in that it:
Matches a given search intent;
Relevant to Coda’s solution (many items in the Gallery can be applied to Coda’s workflow automation boards);
Is created through Coda (using its platform and toolkits).
So, here you have it.
Coda’s Gallery, indeed, is a great case to study. Not often can one encounter a website subfolder driving 99.7% of a site's entire traffic.
Final thoughts
Not only do they know positioning and messaging, but they also know how to grow their website’s traffic.
Coda’s case is full of useful lessons for today’s B2B (SaaS) companies.
The strategies and tactics they used are now known to you.
Implementing them, though, doesn’t guarantee any success.
Because the brand behind all this is equally if not more important than the execution itself.
After all, brand building is still one of the most defensible strategies you can bet on.
Everything else sits on top of and gets amplified on the basis of a great brand.
See you next week!


