The SaaS that found a gap in the market
The power of spotting demand: The Org’s path to growth
👋 Hey, I’m George Chasiotis. Welcome to GrowthWaves, your weekly dose of B2B growth insights—featuring powerful case studies, emerging trends, and unconventional strategies you won’t find anywhere else.
It was one of those calm and relaxing weekends, and I was watching an episode of My First Million podcast.
I don’t remember which episode it was or who was talking when the name “The Org” was dropped.
Apparently, this was a successful SaaS company that was doing org charts.
“Org charts?” I wondered.
Yep, and they were so successful that they raised $20M in their Series B.
I was intrigued.
I Googled the company’s name, and it seemed like Sam’s and Shaan’s (hosts of the My First Million podcast) description of the company (and its fundraising status) was accurate.
I visited the website and clicked on the bookmarklet of my browser that reads “Ahrefs Overview.”
Opening Ahrefs’ Overview report, it seemed that these folks were onto something.
They found a nice gap in the market and attacked it through organic search.
Here’s how.
What is The Org?
First things first, I believe it’s worth giving a brief overview of what The Org is all about.
In a nutshell, The Org is the largest database of real-time organizational charts from companies around the world, currently including over 200,000 charts!
The following LinkedIn post by one of the co-founders speaks for itself:

To give you more context however, The Org is great for a number of use cases, such as:
Attracting talent
Prospecting for B2B sales
Employer branding
And more, since as well as charts, it provides in-depth information about companies and their employees.
What’s more, after clicking on someone, you can see:
Some basic information (1)
A description of them (2)
Contact information (3)
Their colleagues in the form of a chart (4)
All of these help in the use cases I listed above.
The question is, how can a SaaS that creates organizational charts manage to grow so quickly?
Let’s take a look at the organic growth breakdown of The Org.
An organic growth breakdown of The Org
It’s obvious that organic search has been one of the company’s go-to-market plays.
To give you a brief overview of where it stands now, it ranks for over 1.2M keywords and receives more than 367K monthly organic visits.
Note: All data is valid as of today, August 28th 2023. My tool of choice is Ahrefs, so all data should be taken with a pinch of salt.
But what SEO tactics has The Org invested in?
Which pages generate the most traffic?
In order to answer those questions, we first need to make the website’s structure more clear.
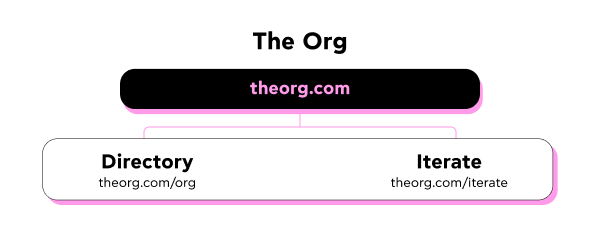
Unlike other websites I’ve studied, this case is quite clear; The Org’s website consists of two subfolders that contribute to its organic traffic:
theorg.com/org
theorg.com/iterate
The former facilitates each company’s chart, and the latter is basically the blog.
Although there are a few other pages (such as the company’s vision and the About Us page), naturally, they don’t contribute to the organic traffic as much, so we’ll only examine the charts and the blog.
Let’s start with the first one.
Directory
By clicking on the Directory page, what comes up is a list of all the companies whose organizational charts can be explored:
And by clicking on a company’s name…
Image Source: theorg.com
…its organizational chart comes up with all the additional information about it:
Image Source: theorg.com
All charts live in the /org/ subfolder, so the URL structure is in the form of theorg.com/org/{company}.
For instance:
theorg.com/org/amazon
theorg.com/org/microsoft
theorg.com/org/disney
And so on and so forth.
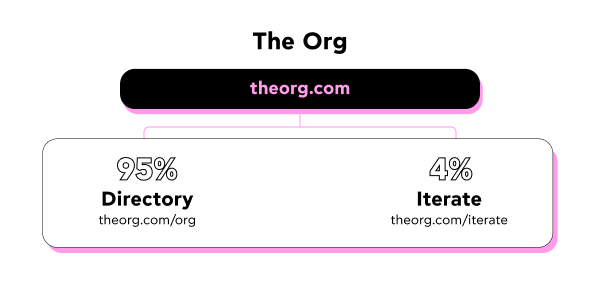
In terms of organic traffic, this section receives 349K visits per month overall, meaning it’s responsible for 95% of the website’s total traffic.
This subfolder’s top performing pages are on the following companies:
JP Morgan (theorg.com/org/jpmorgan-chase)
Boston Celtics (theorg.com/org/boston-celtics)
Golden State Warriors (theorg.com/org/golden-state-warriors)
Google (theorg.com/org/google)
Amazon (theorg.com/org/amazon)
However, those pages can be further broken down into their individual stakeholders and their teams.
In fact, some pages of individual stakeholders also perform really well, such as that of Patrick Lynch from the Boston Celtics and Patrick XU, who is the CEO of Shein.
The website’s second-best performing keyword (in the US) is actually of another individual: Florentino Perez.

The URL structure for individuals follows the form of theorg.com/{company-name}/org-chart/{persons-name}.
For example:
theorg.com/real-mardid-c-f/org-chart/florentino-perez-rodriguez
theorg.com/shein/org-chart/chris-xu
theorg.com/boston-celtics/org-chart/petrick-lynch
When it comes to the teams, The Org offers access to three types:
Leadership Team (theorg.com/org/{company}/teams/leadership-team)
CEO and Executive Team (theorg.com/org/{company}/teams/ceo-and-executive-team)
Board of Directors (theorg.com/org/{company}/teams/board-of-directors)
Of course, each page contributes a different amount to the website’s organic growth, but let’s look at a general overview of the structure before we dive into their performance.
What I did was gather all the monthly organic traffic data for those three sections, in order to see their performance.
Note: The analysis was based on the first 1,000 pages of each section, so, while not perfect, it still gives us a good idea of how well each one performs.
Here’s what I found:
Pages about company charts attract 94.6K monthly organic visits
Pages about individuals attract 16K monthly organic visits
Pages about teams attract 17.3K monthly organic visits
To put things in perspective:
Company charts contribute ~25.7% to the total organic traffic
Individuals contribute ~4.3% to the total organic traffic
Teams contribute ~4.7% to the total organic traffic
It’s no surprise that company organizational charts are what perform the best; after all it’s what the website is all about and what most users are interested in seeing.
Now that we’ve seen how this section performs, let’s move on to the blog.
Iterate
Like most SaaS companies out there, The Org has also invested in a blog section (which it calls Iterate) in order to attract organic traffic, and more.
As an overview, the blog in general attracts 14.5K monthly organic visits on average…
…through 19.4K organic keywords in Google’s SERPs…
This means that the blog contributes almost 4% to the website’s total organic traffic, which makes sense since the Directory contributes 95%.
When it comes to the topics covered through the content, they vary since they range from employer branding and talent acquisition to sales enablement and job title explanations.
In essence, they revolve around The Org’s use cases that we saw earlier.
By far, the best-performing blog post is on what companies Amazon owns…
Image Source: theorg.com
…which generates almost 2K monthly organic visits, or 13.1% of the blog’s total traffic.
The rest of the top performing posts are on:
What companies Jeff Bezos owns (6.2% of the blog’s traffic)
What companies Google owns (5.2% of the blog’s traffic)
What companies Microsoft owns (5.2% of the blog’s traffic)
So the pattern here is clear.
Posts on what companies other companies/people own are the ones that are performing the best and this is a tactic The Org has utilized well.
Of course, there are many more opportunities for such keywords to target, even high-volume ones.
I assume one of the main reasons why The Org has decided to target such keywords, is because they can be combined with what The Org offers.
What I mean is that by listing different companies it provides a great opportunity to feature their organizational charts through The Org in order for readers to discover what it’s all about.
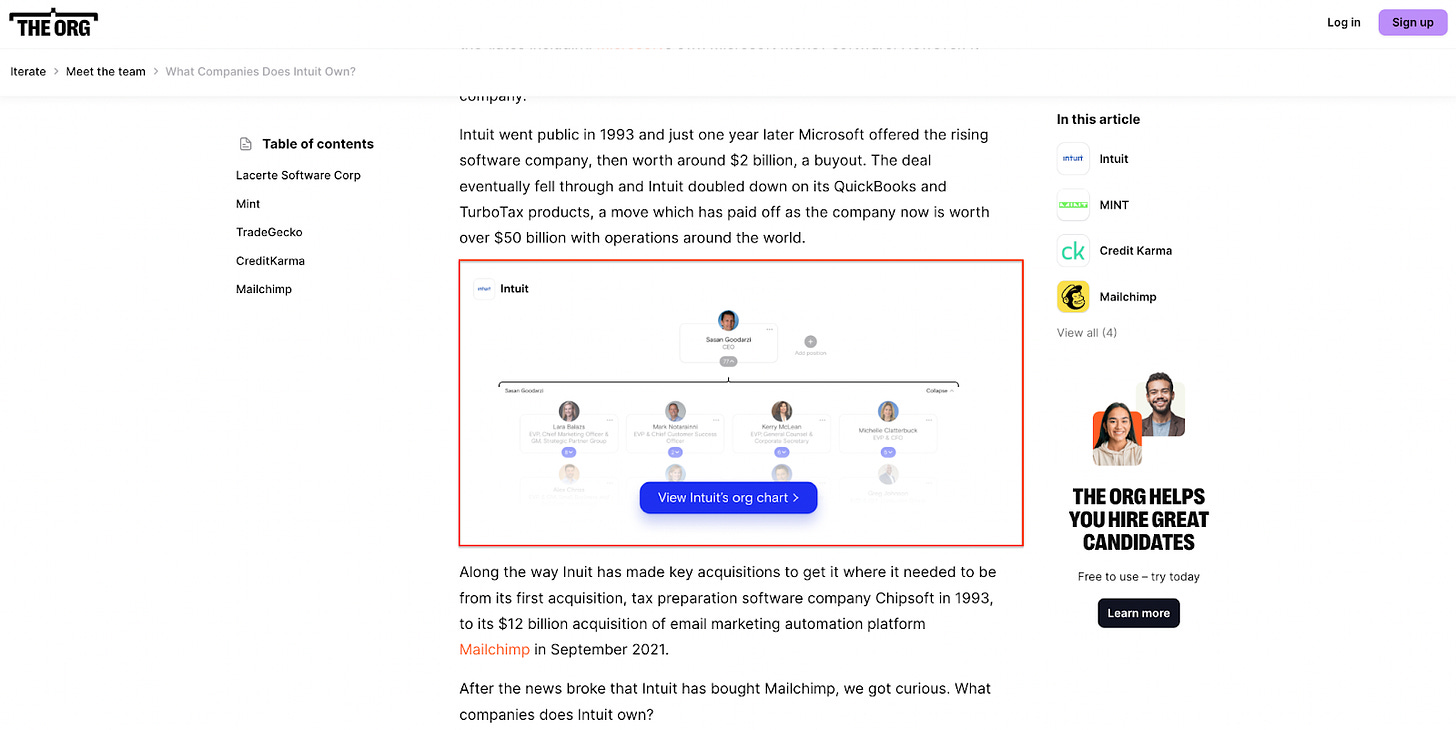
For example, in the following post on what companies Intuit owns, one of the companies listed is Mailchimp…

…so when a user clicks on the anchor text, they’re directed to Mailchimp’s organizational chart:
This is a great way to promote what The Org offers.
Would it have been better to embed the charts in the blog post, like in the example I created below?
Or even add them as CTAs, as they’ve already rightfully done in some cases?

Perhaps, but blog posts such as these are a great way to showcase the product’s value nevertheless.
Other topics The Org has taken great advantage of are ones explaining job titles, such as:
All of these are also a good way to combine them with product-led SEO, since the position of a person within a company can be featured through a chart:
Although the blog isn’t crucial to the company's organic growth—at least in terms of traffic—it’s clear that it’s a great way to showcase the product’s value through targeted content as we saw above.
This can be summed up by the Directory being responsible for 95% of the website’s total organic traffic, while the blog has 4% of it!
Let’s wrap things up with some final thoughts.
Final thoughts
The growth of The Org—at least from an organic standpoint—is quite impressive.
Who would expect that people would search for org charts online and would be willing to give their credit card details and pay for such software?
Market needs and demand beat assumptions or convictions every time, though.
The Org did a great job at spotting the demand and attacking it through organic search.
Whether or not this has an impact on the company’s bottom line and revenue growth is something we’ll have to wait and see.
For now, I hope you enjoyed today’s note, learned something, or got inspired for your own company or the company you’re working for.
See you next week!


