250K monthly visits in 12 months
How Descript scaled to 250K monthly visits in just 12 months
👋 Hey, I’m George Chasiotis. Welcome to GrowthWaves, your weekly dose of B2B growth insights—featuring powerful case studies, emerging trends, and unconventional strategies you won’t find anywhere else.
“We’re not like Descript; we can’t publish one new post per day,” my friend said.
“One post a day?” I asked.
“Yep, that’s why they’re growing so fast,” he concluded.
“I’ve got to check this,” I thought.
It seems that my friend was right.
Because Descript went all-in on its organic growth.
Does it pay out in terms of pipeline and revenue generation?
We can’t answer that question.
But, we can break down how they managed to add 250K monthly visits in 12 months.
This is going to be a long one, so put your eyeglasses on, pick a lo-fi mix on YouTube, and let’s get into it.
Key findings
Descript’s case is quite fascinating, but before we immerse ourselves in it, let me give you a quick overview of my discoveries.
One landing page and two subfolders with 102 pages can already drive 80% of a website's traffic.
Yet, only 13% of these pages will be real heavy lifters in terms of traffic.
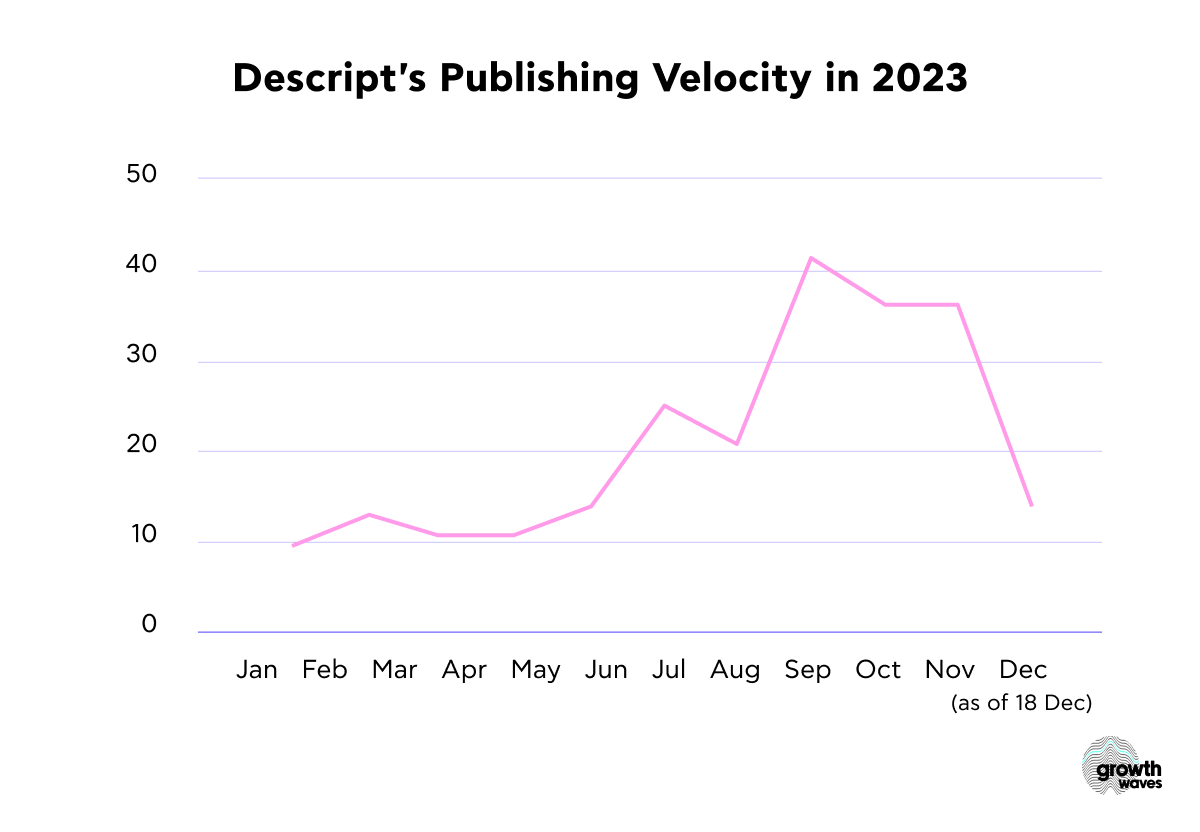
Consistency in content publishing (a.k.a. playbook publishing velocity) isn’t always responsible for traffic growth. This year, Descript published content at different rates, going from 21 pieces in August to 41 in September.
Publishing content at scale can drive organic traffic in general. Descript’s published posts as of December 18, 2023 amount to an 82% increase in traffic.
However, there’s one stipulation—the content should be of the highest quality. Descript’s content pieces are well-optimized for search, with the top performance having an A- grade on Clearscope.
It also doesn’t matter whether the content piece is a long read or not—as long as it answers the intent, it has all the chances to get to the top of SERPs. Descript’s Best Times to Post on Facebook article is 2,253 words, which is 60% less than one of its top-competing pieces.
Your traffic growth may seem slower percentage-wise compared to previous results, but it doesn’t mean that your website isn’t growing.
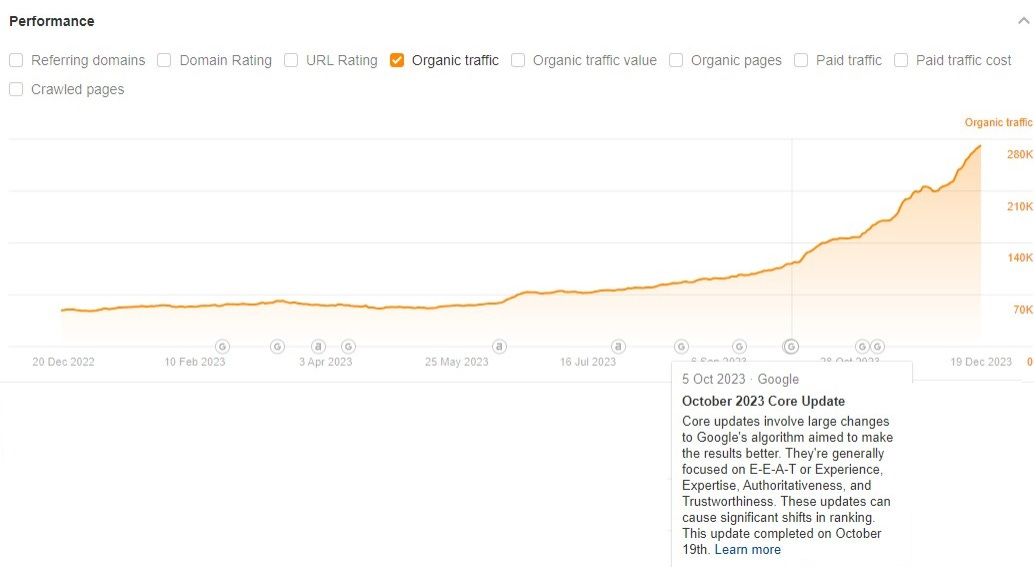
This year’s Google updates didn’t pass by Descript’s website, and it experienced exponential growth nonetheless.
Intrigued?
Let’s start the discussion.
Organic growth breakdown
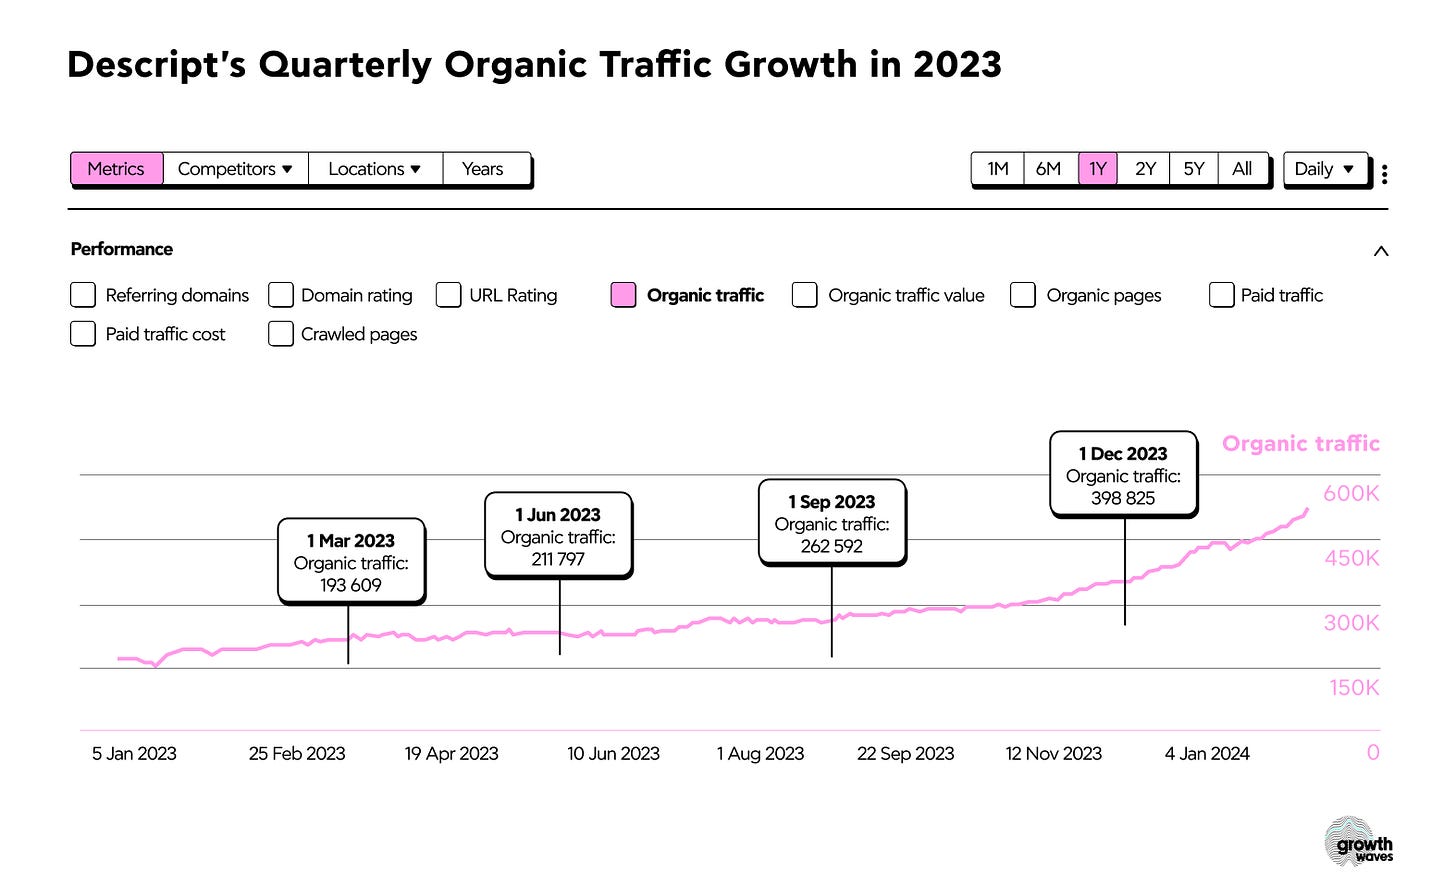
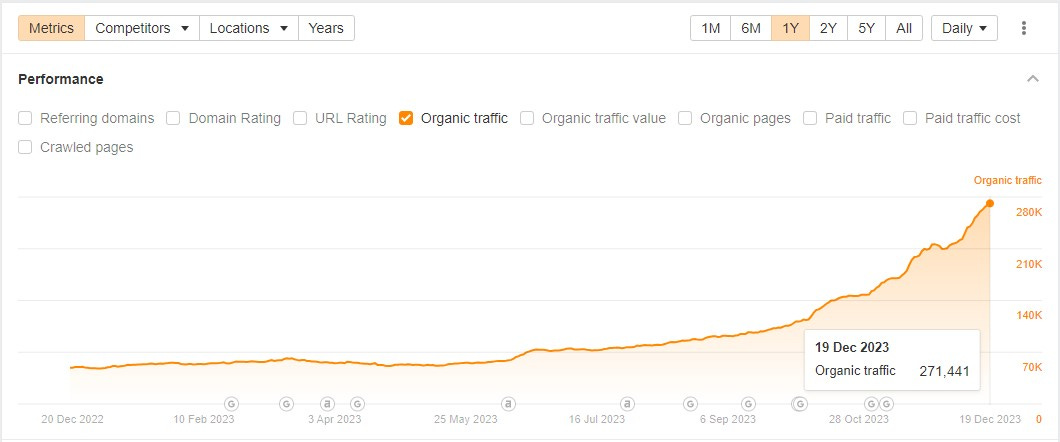
It’s safe to say that Descript’s organic traffic has been growing consistently this year.
And here’s what the quarterly organic traffic growth looks like in percentages:
23% increase between Q1 and Q2
16% increase between Q2 and Q3
16 % increase between Q3 and Q4
We can also calculate an approximate organic traffic growth rate for the last quarter since it’s almost over.
Currently (as of 8 December 2023), Descript’s traffic reached 449,999 visits.
So, simple math calculates that the traffic increased by 38% compared to the results from 1 October.
What’s behind these results?
There are several elements at play.
Let’s break them down.
Element #1: Website architecture
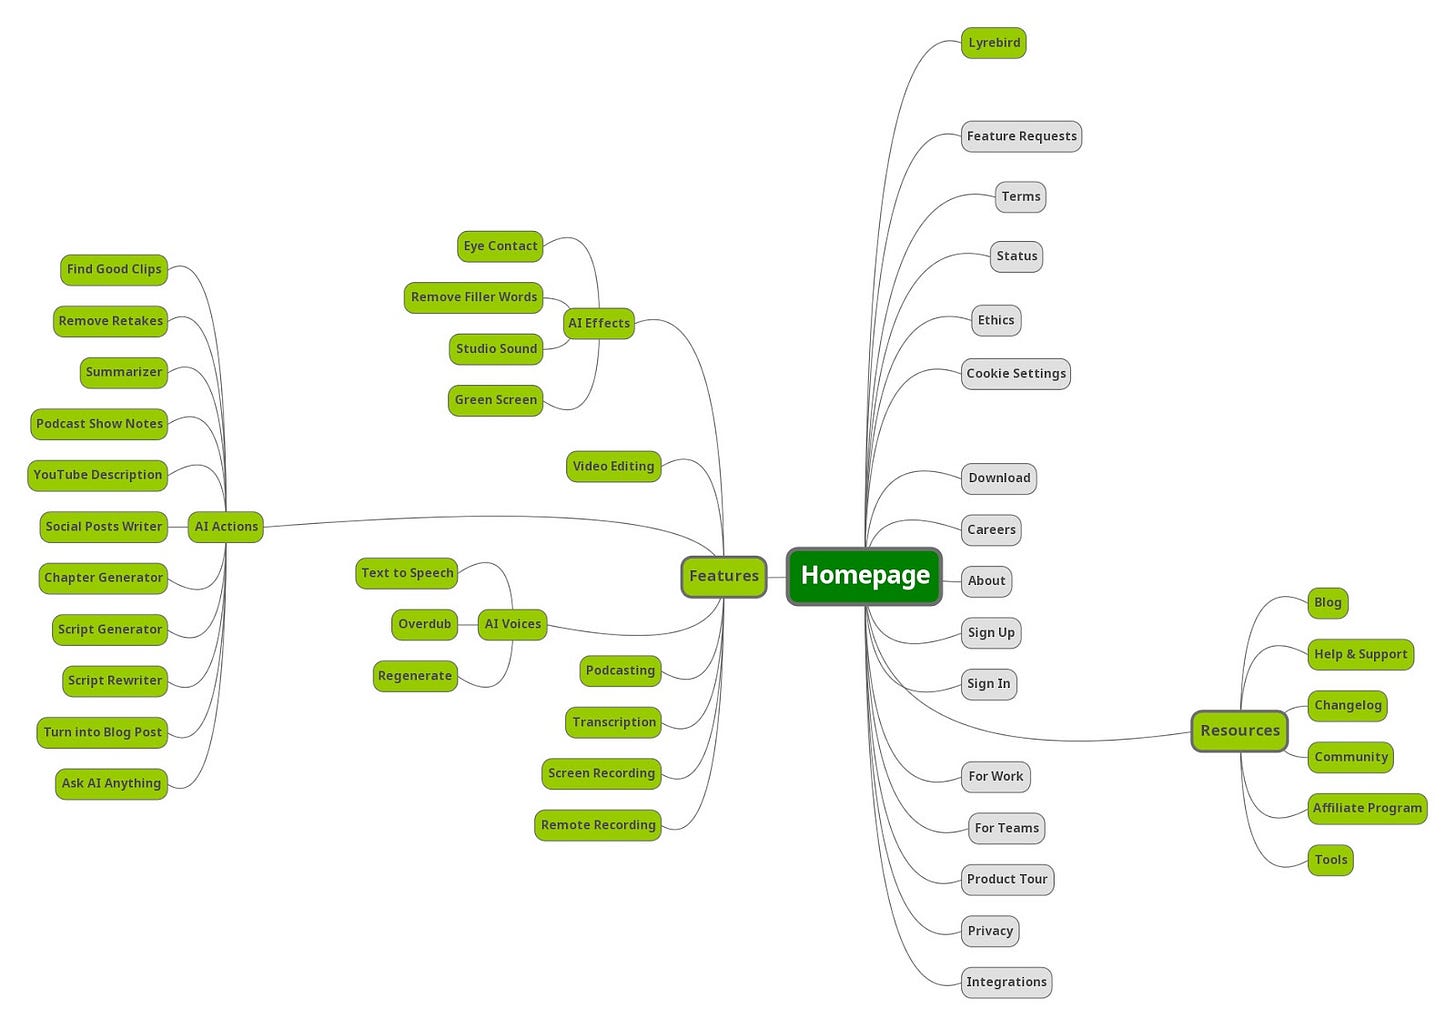
Descript’s website architecture is quite layered.
Of course, not all architectural elements impact organic growth.
So, after tinkering with Ahrefs, I picked the following landing page and folders for analysis:
Lyrebird AI
Features
Resources
You can also see them highlighted in the website structure above.
Okay, let’s start exploring.
Landing page: Lyrebird
Lyrebird AI was a Canadian startup working on a new generation of speech synthesis technologies.
Essentially, the technology they developed was able to mimic anyone’s voice after listening to and analyzing a one-minute audio.
A rather unique opportunity for a video editing tool, right?
Indeed.
Descript acquired Lyrebird AI in 2019 as a part of their product-led motion.
Not only did it add a new solution to Descript’s toolkit, called Overdub, but it also gave the website’s organic performance a great boost.
Let me elaborate.
The lyrebird.ai website appeared six years ago—you can spot the first signals in the Wayback Machine in April 2017.
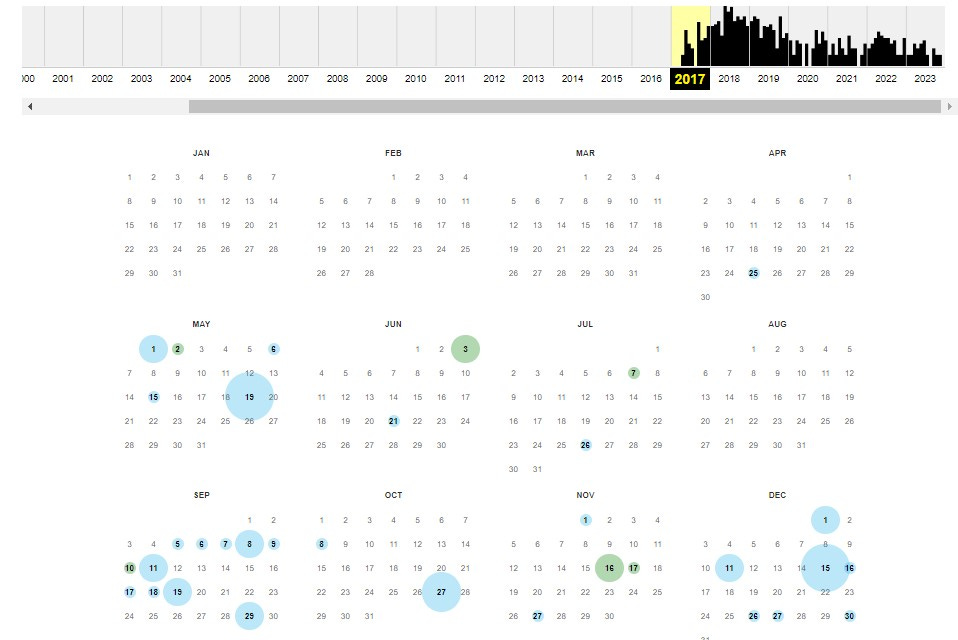
After almost three years, by the time of acquisition, the website reached over 60k in traffic before being redirected to a page on Descript’s website.
Currently, the Lyrebird page brings 14.1k monthly traffic and ranks for 880 keywords.
How much is it from Descript’s total traffic?
Of course, 3% is not much, but it’s still a solid contribution to the website's continuous growth.
Now, let’s move on to the website folders mentioned earlier.
We’ll start with Features.
Features folder: Transcription, Overdub, and others
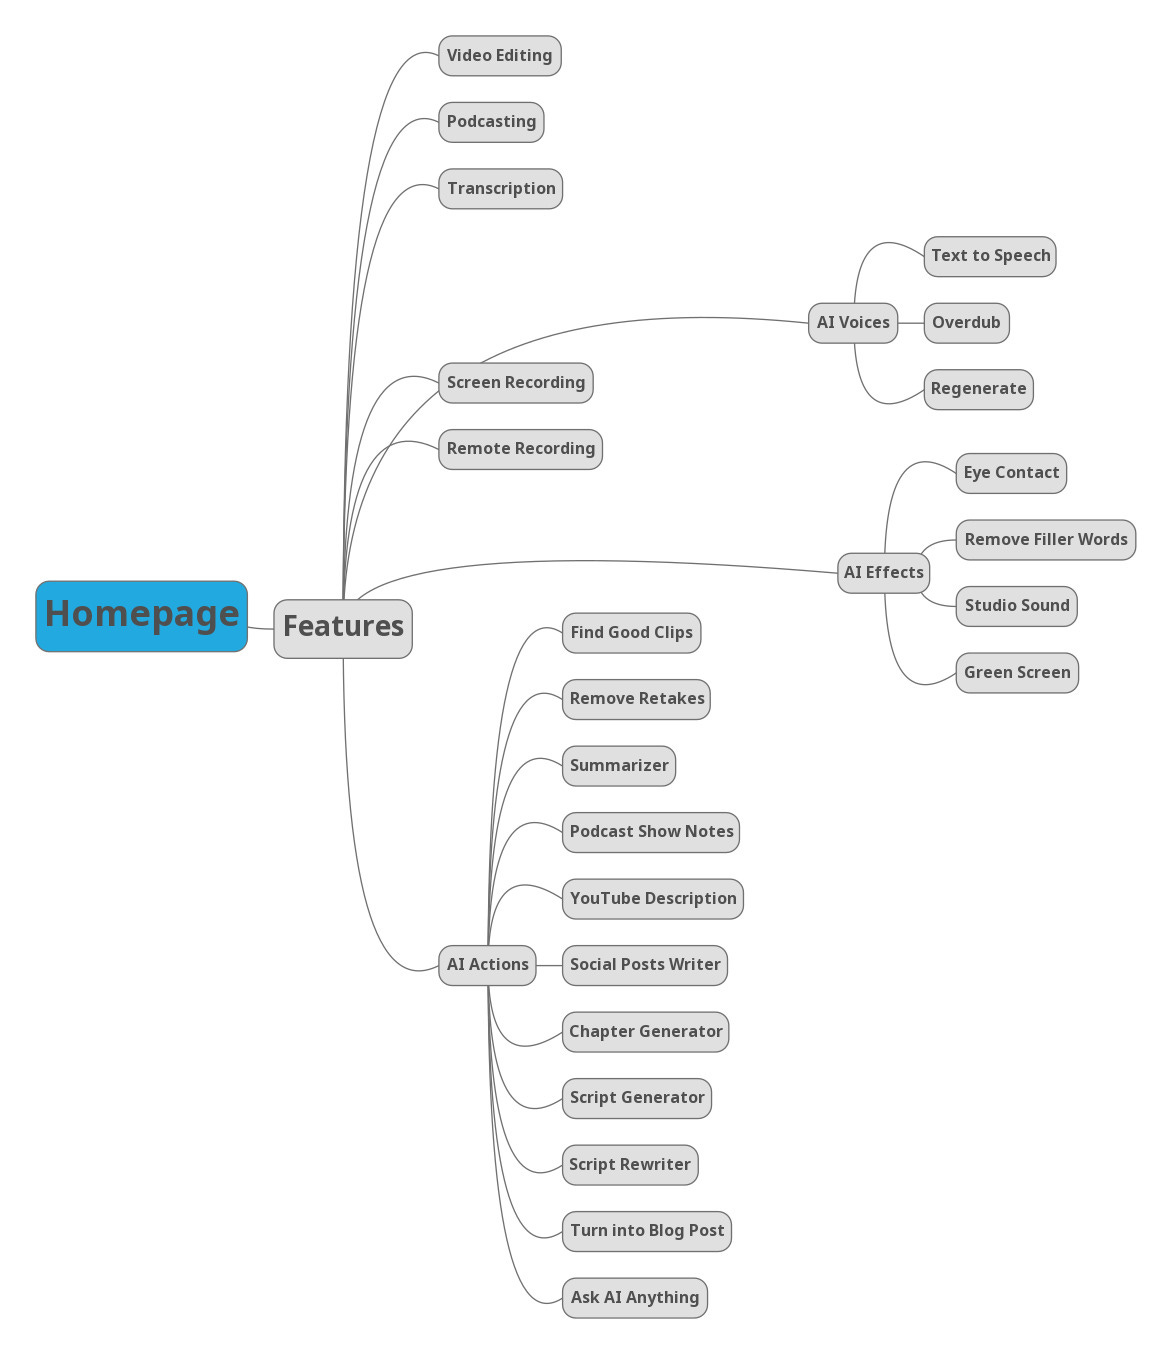
Now, there’s no actual Features page on Descript’s website.
However, there is a drop-down list containing 24 landing pages pointing to different capabilities offered by Descript’s product.
Of course, these pages don’t have equal organic performances.
Let’s break down their traffic and keywords to understand why some deliver better results than others.
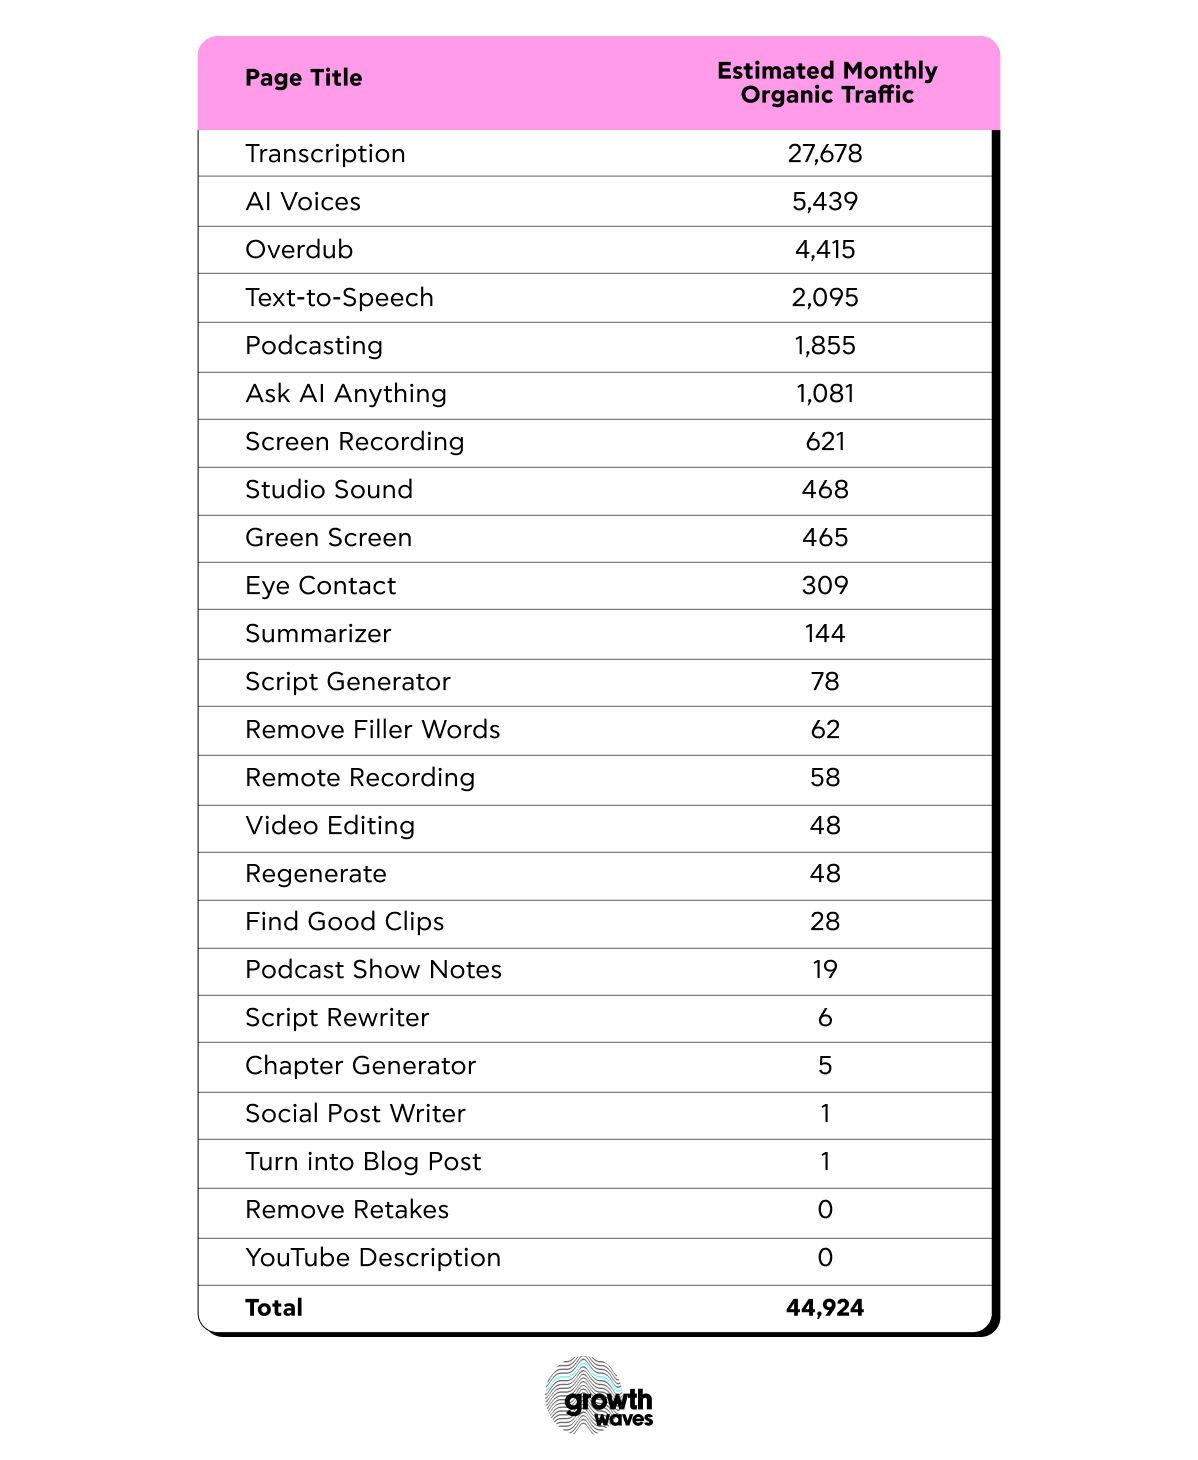
Now, how many monthly visits do these pages generate?
Here’s a complete breakdown, with the total organic visits from all the pages.
Note: Data as of 18 December 2023.
How much would the composite traffic of all these pages account for if we take Descript’s current traffic of 449,999 a month?
The estimated value of such traffic would be approximately $20,765 (based on the current overall traffic value).
Now, what about keywords?
Here’s a page-by-page overview
So, all the landing pages in the Features subfolder amount to 11,468 keywords.
This is about 5,6% of all the keywords the website ranks for (205k as of 18 December 2023).
You might have already noticed a drastic difference between the performance of these pages.
Why is it so?
While looking through the data, I picked up the following three reasons:
Targeting the wrong keyword;
Keyword is competitive;
The page is new.
Let’s start with the first one.
Some pages fail to target the right keyword, thus attracting the wrong visitors.
The Find Good Clips page is a good example.
According to Ahrefs, its top keyword is good clips, with a search volume of 500.
Already too broad and vague, right?
Google results reflect the same—top pages come from sources targeting very different intents.
However, if we return to the landing page, we’ll see that it’s not just about good clips.
It’s about how to create podcast highlights.
You can notice this intent throughout the page.

And, if you check the search results for the create podcast highlights keyword, you’ll see many of Descript’s indirect competitors among the top pages.
This is one reason.
Other pages target keywords that are simply too competitive.
For instance, the main keyword for the Screen Recorder feature page is screen recorder, which has 82 KD and 108k SV.
As you can see, the page has also started losing its position in SERPs because of high competition.
However, this is not a rare occurrence.
After all, the competition in the video production industry is fierce.
Finally, some pages have appeared on Descript’s website very recently, meaning they didn’t have enough time to pick up speed in terms of traffic and keywords.
The Find Good Clips page is one example.
I’ve also pinpointed the Remove Retakes page, which is relatively new and has no traffic yet.
Thus, some pages need more time, while others require further optimization to make sure they target the right audience.
Next on the list comes the Resources folder.
Resources folder: Blog
As it turns out, my friend wasn’t quite right when he said that Descript published one post per day.
In fact, he was way off.
I went back 12 months and discovered some gaps between published content pieces.
However, on some days, Descript posted several articles.
Take 30 November, for instance.
A whopping seven posts in one day!
Naturally, such a content volume provoked a logical question.
Does Descript follow a specific publishing velocity pattern?
After digging into some data, I’d say no, given there is no consistency in the number of posts published monthly.
Take a look.
You can see some spikes in the number of published articles (e.g., 21 in August and 41 in September) followed by a slight decline.
Yet, it doesn’t mean that the lack of playbook consistency in publishing velocity didn’t bring any results.
In 2023, Descript has published 247 posts so far (as of 18 December).
This accounted for a consistent traffic increase, as you can see in the graph below.
Thus, a very sizable portion of Descript’s traffic comes from its blog.
But how rapidly did traffic grow this year compared to 2022?
Here’s what traffic growth looked like last year.
Note: Data for the 1st day of every month in 2022.
And here is what this growth looks like in percentages.
61% in Jan-Feb
-20% in Feb-Mar
73% in Mar-Apr
46% in Apr-May
12% in May-Jun
17% in Jun-Jul
46% in Jul-Aug
30% in Aug-Sep
7% in Sep-Oct
17% in Oct-Nov
63% in Nov-Dec
Now, let’s take a look at this year’s traffic growth.
Note: Data for the 1st day of every month in 2022.
Let’s also review it in percentages.
10% in Jan-Feb
6% in Feb-Mar
-3% in Mar-Apr
-5% in Apr-May
5% in May-Jun
23% in Jun-Jul
8% in Jul-Aug
14% in Aug-Sep
14% in Sep-Oct
28% in Oct-Nov
30% in Nov-Dec
So, it’s an average of 37% in 2022 against 14% in 2023.
Doesn’t make sense?
I hear you.
But take into account this year’s numerous Google updates that have impacted Descript’s traffic.
If you look back at the growth percentages above, you’ll see dips in traffic between March and May.
I attribute this decrease to the March Core Update, the implications of which lasted several months after it rolled out.
However, if you look back at the Blog’s overall traffic, you can see that it starts picking up between August and September 2023 and really booms after the October Core Update.
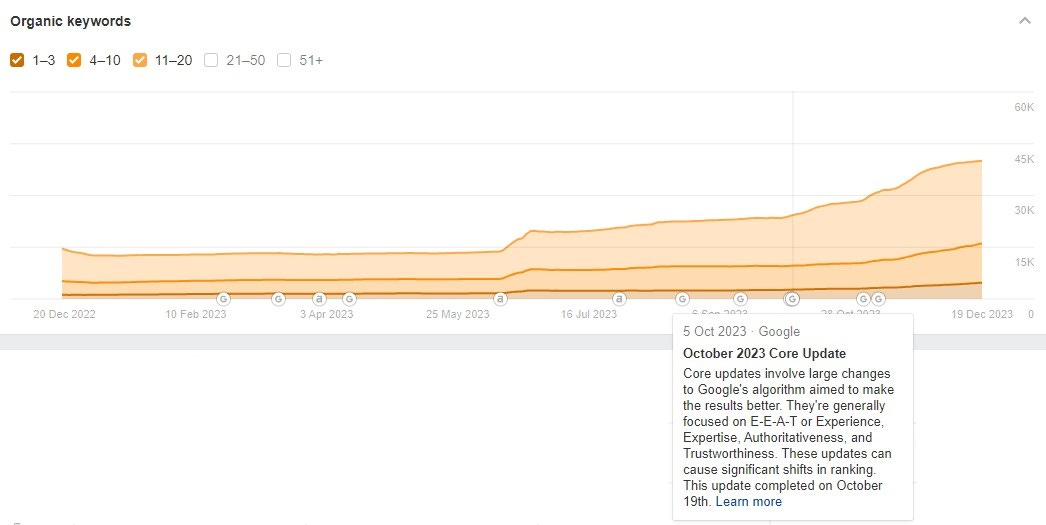
The growth of organic keywords for positions one through 20 also started progressing more around the time of the October Core Update (overall, blog accounts for 78% of all website keywords).
Okay, so what’s the verdict?
Publishing velocity – or, to be more precise, publishing content in large numbers – helped boost Descript’s traffic, although hindered by Google updates.
However, this strategy cannot be sustainable if the content is of poor quality.
How is it in Descript’s case?
I’ll share my findings a bit later.
Now, let’s return to another folder accountable for almost 7% of Descript’s traffic.
Resources folder: Tools
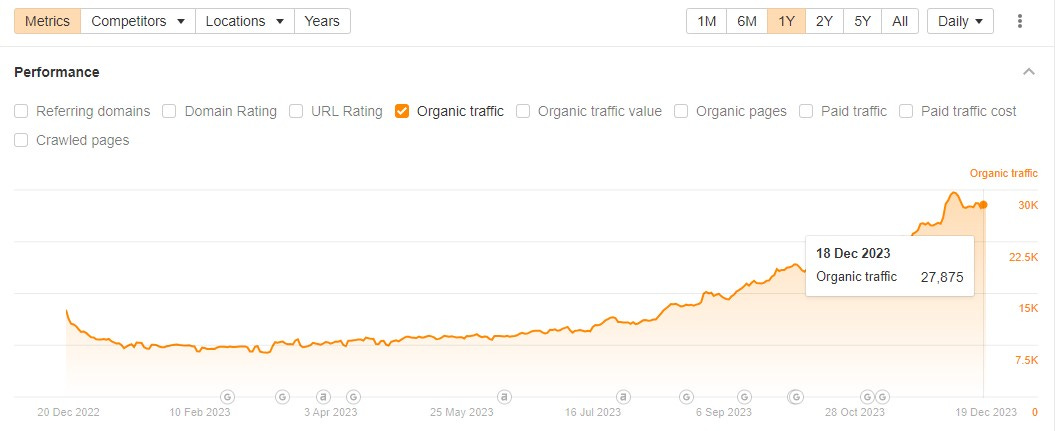
Besides the Blog page, we have the Tools subfolder that delivers almost 30k monthly traffic.
What is this page?
It’s a collection of landing pages explaining how Descript’s audio and video tools work.

Each page includes a walk-through of a specific tool, frequently asked questions, and extra articles to learn more.
So, we can say that this subfolder serves as an additional information source for Descript’s users alongside the Help Center.
Okay, back to its role in organic growth.
As mentioned, the Tools subfolder carries a sizable portion of Descript’s traffic—27,875 visits as of 18 December.
This amounts to 7% of total traffic.
Similar to the Features pages discussed earlier, not all the pages under the Tools umbrella perform equally in terms of traffic.
Here’s the breakdown of all the pages under this category to visualize their estimated monthly organic traffic.
As you can see, only a handful of pages carry the weight.
However, it doesn’t mean something is wrong with those who lag behind.
Similar to what was discussed in the Features section, some of these pages are new, and others target a keyword with a lower search volume compared to others.
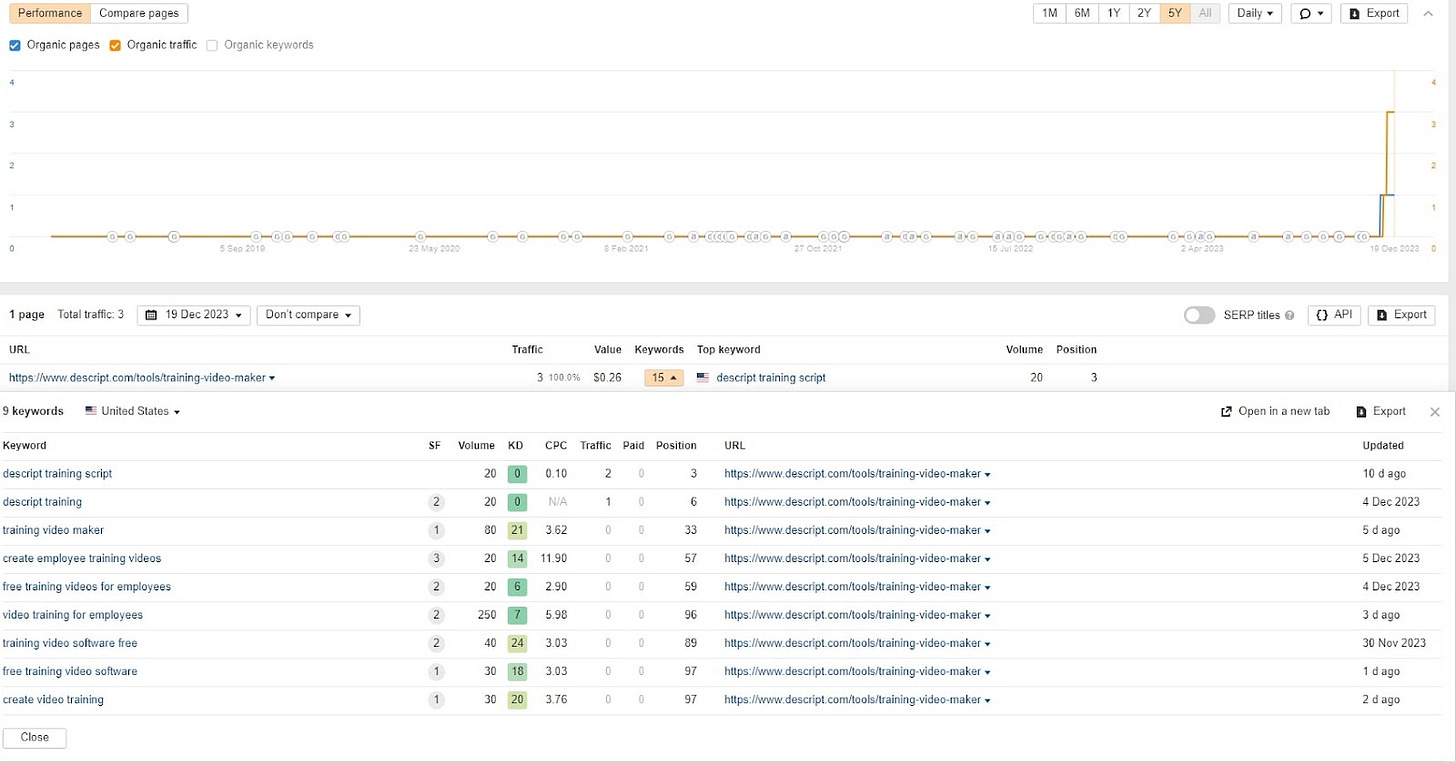
The Training Video Maker page hits two birds with one stone here, in the sense that its slow performance is attributed to the fact that the page is new, and most keywords it’s picked up have low search volume.
However, the picture looks very different if we take the best-performing page.
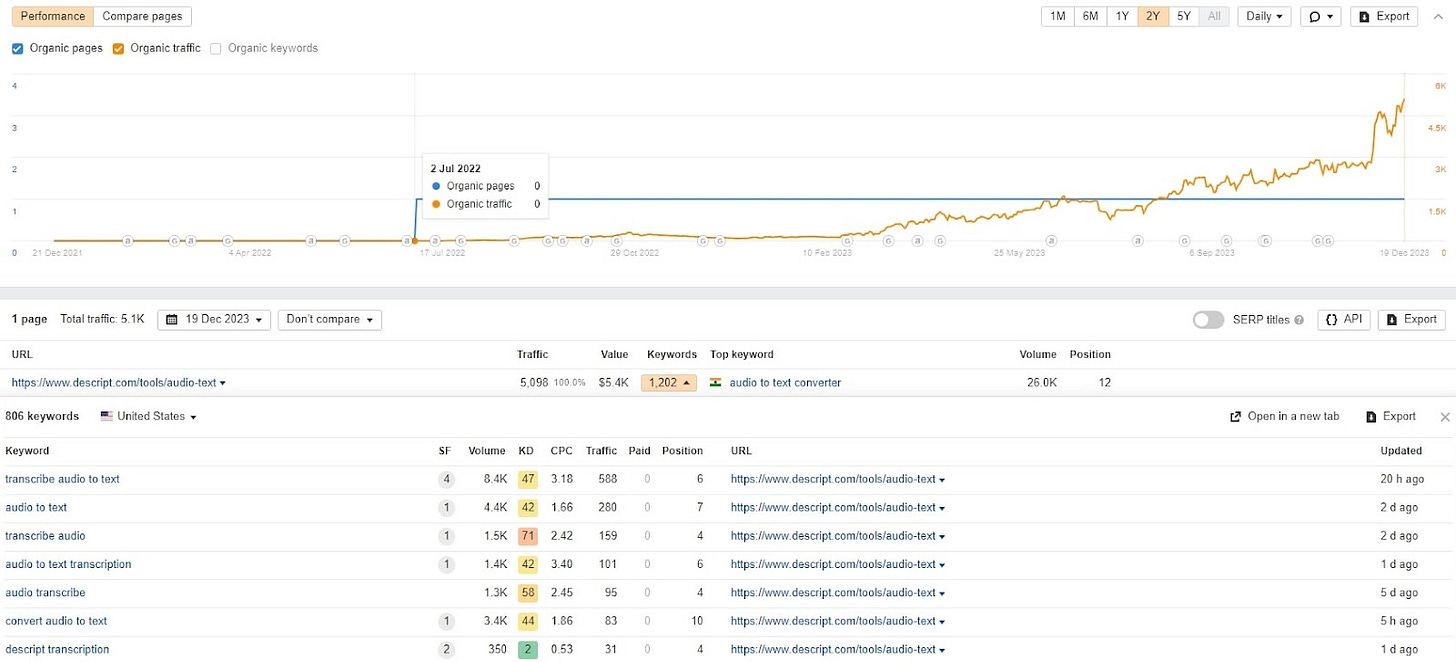
The Audio to Text page was created approximately in July of last year, and it took 12 months for it to get the performance it has now.
It’s also not unlikely that some older pages need further optimization and updates to pick up the speed.
Now, back to the role of the Tools subfolder in the organic growth of Descript’s website.
What about the keywords it brings to the table?
According to Ahrefs, all the pages in this subfolder collectively target 22k keywords, which is more than all the landing pages in Features.
Let’s see what percentage this number amounts to from the total number of keywords.
10% is a considerable amount, which brings me to the conclusion that these pages carry significant value for Descript users, guiding them through the entire toolkit.
Alright, the Website Architecture box—check!
Let’s continue our discussion of Descript’s organic growth with what I’ve promised.
Content breakdown and on-page optimization.
Element #2: On-page optimization
If you remember, Descript’s blog has more top-ranking pages than any other subfolder on the website.
Here’s the confirmation of this—out of ten top-ranking pages, seven are blog articles.
So, at first glance, it seems that Descript’s content does quite well.
But is it really so?
Let’s dive deeper into on-page optimization to answer this question.
For instance, out of the list in the above image, let’s take the top-ranking article on the best times to post on TikTok.
The general overview shows that this post ranks for 1,941 keywords.
Besides, the article ranks on top and is listed in the featured snippet for the search term best times to post on TikTok 2023.
To further inspect this content piece, I went to Clearscope, which we also use for our clients at Minuttia.
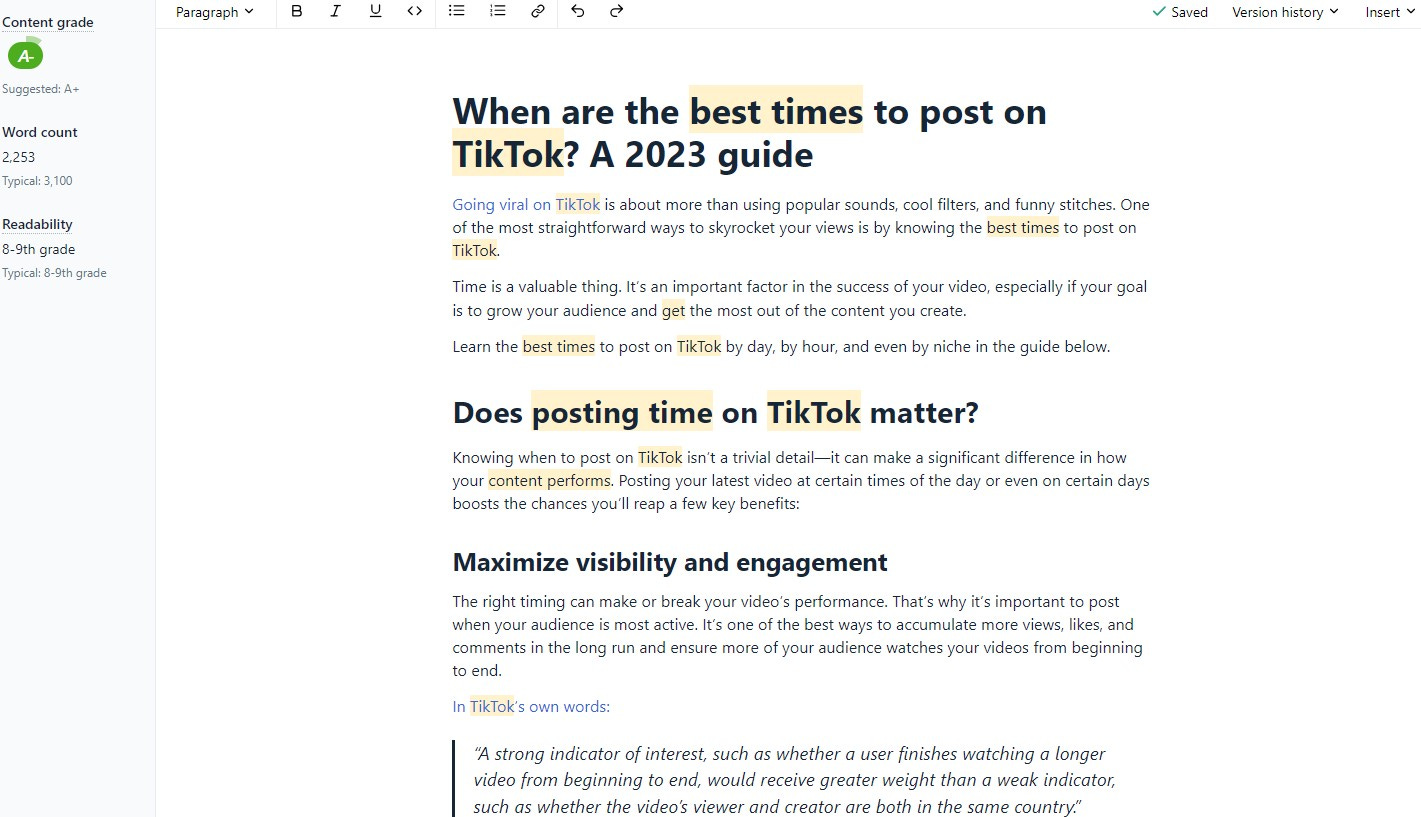
As you can see, the general content grade for this piece is A-, indicating that the page is optimized for relevant search terms quite well.
However, what differs is the word count and readability grade.
The article has 2,253 words. For context, here are the word counts of the competing pieces:
Influencer Marketing Hub—2,807 words;
SocialPilot—4,675;
Shopify—3,184;
Buffer—3,109;
Sprout Social—2,959.
Naturally, these results bring forth the following question.
How important is word count in content’s organic growth?
I’d say there is no definitive answer.
Google’s John Mueller said that word count is not a quality factor.
However, he also mentioned the following in his interview with a SEJ staff member.
“It’s a bit like if you want to present something to a client who’s walking in, you can give them a one- or two-page brochure, or you can give them a giant book of information. And, in some cases, people will want a book with a lot of information. And, in other cases, people want something short and sweet.”
So, one can assume that it’s a question of intent.
Furthermore, if the content fails to convey the intent, it won’t attract backlinks that help it rank higher simply because its word count is larger than in competing pieces.
Viola Eva, Founder of Flow SEO, voiced the same opinion in her article for SEJ.
“Remember why users are coming to your page; satisfy their intent and give them what they seek. By doing this, you’ll also make your content an appealing backlink for other creators.”
So, does Descript’s top-ranking article satisfy the target user’s intent?
I’d say yes.
The search term best times to post on TikTok indicates that a person wants a quick answer on what day and time of posting will bring them more views.
Descript’s article caters to this intent very well—you’ll find bullet lists with best and worst publishing times divided by day, location, and industry.
Thus, based on this example and the fact that many other blog pages rank well (many are listed in featured snippets), we can conclude that Descript does a good job with on-page optimization.
Missed opportunities
During my analysis of Descript’s organic growth, I shared a few points of improvement, such as optimizing a page for a different (more relevant) keyword, which could further help Descript’s online presence.
However, I’ve also pinpointed a few growth opportunities the company missed but would definitely benefit from.
Take a look.
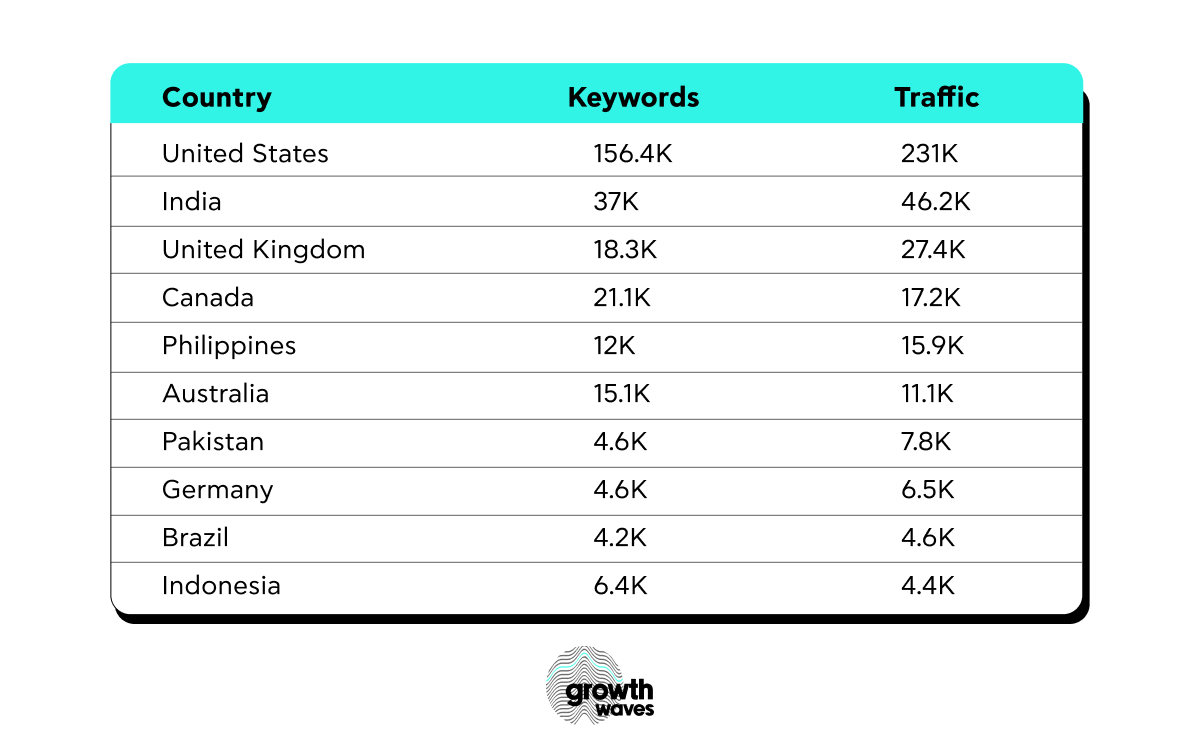
Localization
Descript primarily targets English-speaking countries.
However, by producing only in English, they miss a big opportunity to reach other audiences, given that a large portion of traffic comes from countries where English is not a dominant language.
Besides, content localization would give Descript a competitive advantage against its rivals.
Linkable assets
This missed opportunity is actually where Descript tarries behind compared to its competitors.
Veed.io, Renderforest, Vidyard, and other platforms with tools similar to Descript’s have some kind of linkable assets that drive extra traffic.
In most cases, it’s free video templates broken down into different categories (e.g., events, themes, or styles).
Comparison pages
How is Descript better than other similar platforms?
It’s hard to tell since there are no tool-to-tool comparison pages.
Meanwhile, having a selection of such pages can help bring more website visits.
Another option is to create a page under the URL www.descript.com/alternatives and share a comparative table of Descript against other tools on the market.
More free tools
Finally, another traffic source could be a set of free tools encouraging users to try out Descript without committing to it.
Descript does have a free version, but it requires a subscription, which is not something every user is ready to do.
Giving free access to one of the tools (e.g., Transcript, given its great organic traffic performance) is a solid option to help Descript facilitate its product-led motion.
Final thoughts
This was a big one!
But it was well worth it.
Descript investing in organic growth makes sense because of the company’s product-led motion.
I believe that they’ll keep growing since there are several untapped opportunities.
Competition is fierce since many of Descript’s product capabilities are (or will be) highly commoditized.
However, the effort they put into developing organic search as a channel is remarkable.
And they got to a point where they started reaping the benefits of their effort.
That’s a good place to be, right?
See you next week!


